PPM Express provides a PPM Express Power BI pack for the Core subscription plan.
In this article, we will give you a general overview and some tips on how to get the most out of it.
Resource Management functionality is out of the scope of the PPM Express Core report pack. This functionality is available in the PPM Express Professional and Enterprise subscription plans (Advanced Power BI Report Pack).
When you configure this report pack, you will be able to review the reports for your Portfolios, Projects, Key Dates, Issues, Risks, PPM Express Tasks.
Portfolios Overview and Projects Overview reports are used to get a high-level overview of your active Projects and Portfolios (including Overall Statuses and Key Dates)

Project Summary report is a comprehensive report that provides multiple views to analyze project data.
 Portfolio Details and Project Details reports allow reviewing the details for a specific project or portfolio.

You can select a specific project or portfolio either using the filters panel:

Or using the 'Drill through' option on other pages of this report pack.

Also, there is a set of reports that allows reviewing task management details.

These reports were designed to answer multiple questions about task management. Here are only several examples of what you can review using the task management reports:
- Resource availability for a certain period of time (including the time and tasks that the resource is allocated for);
- Overview of the tasks with urgent priority where status is Critical/At Risk, etc.
- Visual charts that allow drilling through the details on each number in the chart.
- Completed work on the project per resource, remaining work, how Planned work is distributed per Role or Department.
- The factors that influenced the distribution of Planned Effort, Completed Work & Remaining Work
- Data quality reports, etc.
By default, only actual data is displayed within the report. The scope of the actual data is determined by the values in the filter panel:

To review the full set of data it is required to clear the filters.
There is a specific Task Dates Filter in the reports that allows performing the following:
- review only the tasks without Start & Due dates;

- review the tasks where at least one date between the Start Date and Due Date is within the selected value (the tasks where the date of the selected value is within the Start Date and Due date interval).

- review only the tasks where the Due Date is within the selected value.

-
Late filter button allows reviewing late tasks (where the Progress is < 100% and DueDate < Today).

It is also possible to review the details for tasks using the drill-through functionality.
Most report visualizations are interactive and can cross-filter or cross-highlight each other. Charts not only display analyzed values but also provide access to the details of the underlying data. To drill through to the details right-click on the selected data point and select the 'Drill Through' option, or click on the number of the tasks on the available diagrams and click on the Tasks Details button below.

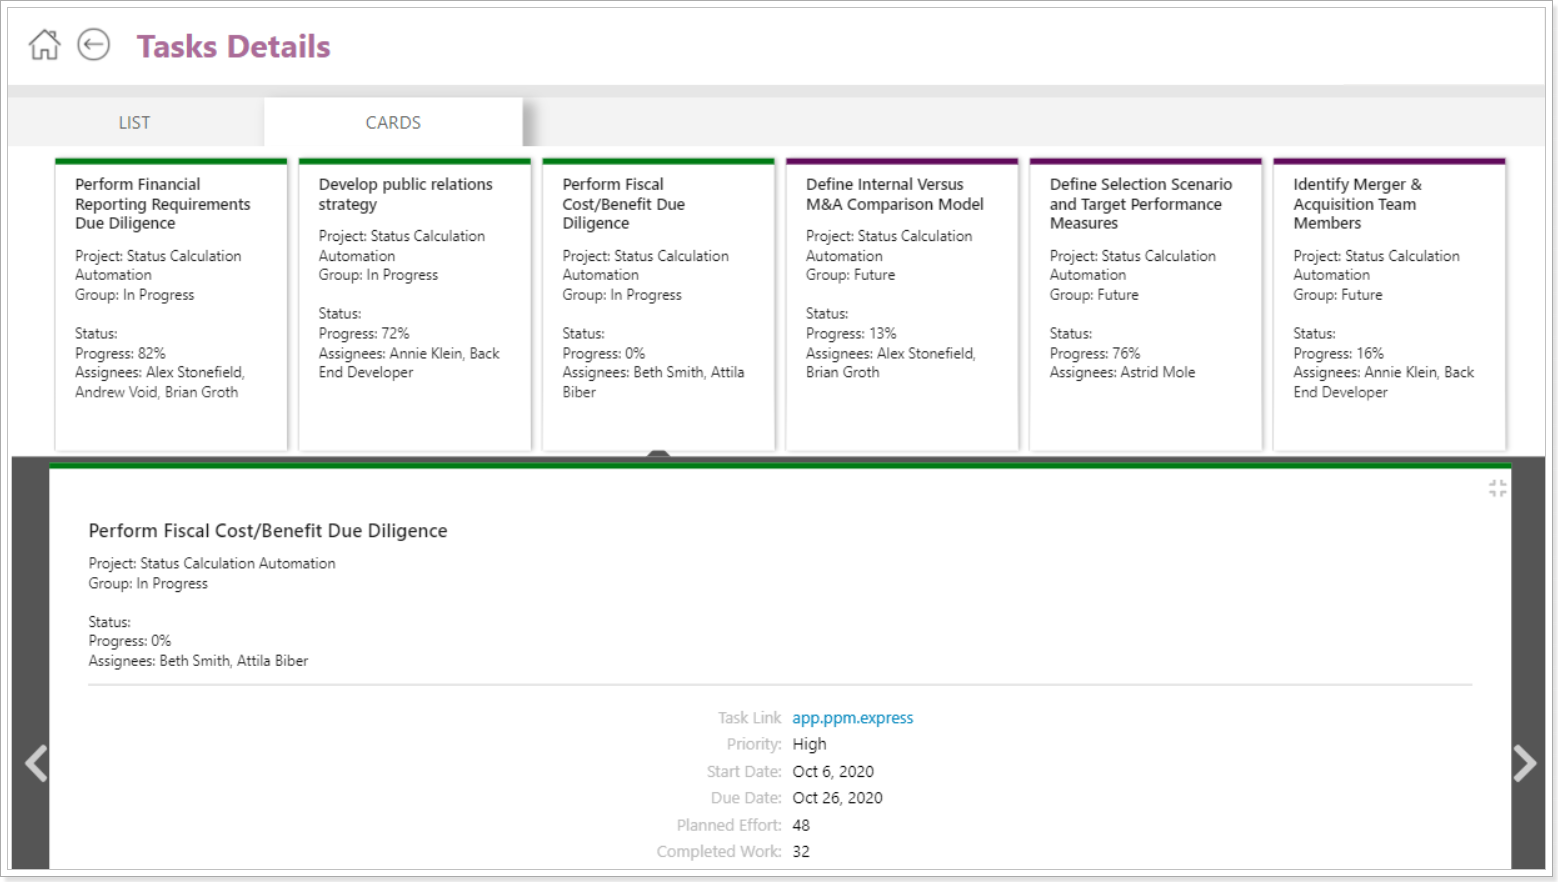
The Tasks Details can be opened in two views:
- as a list
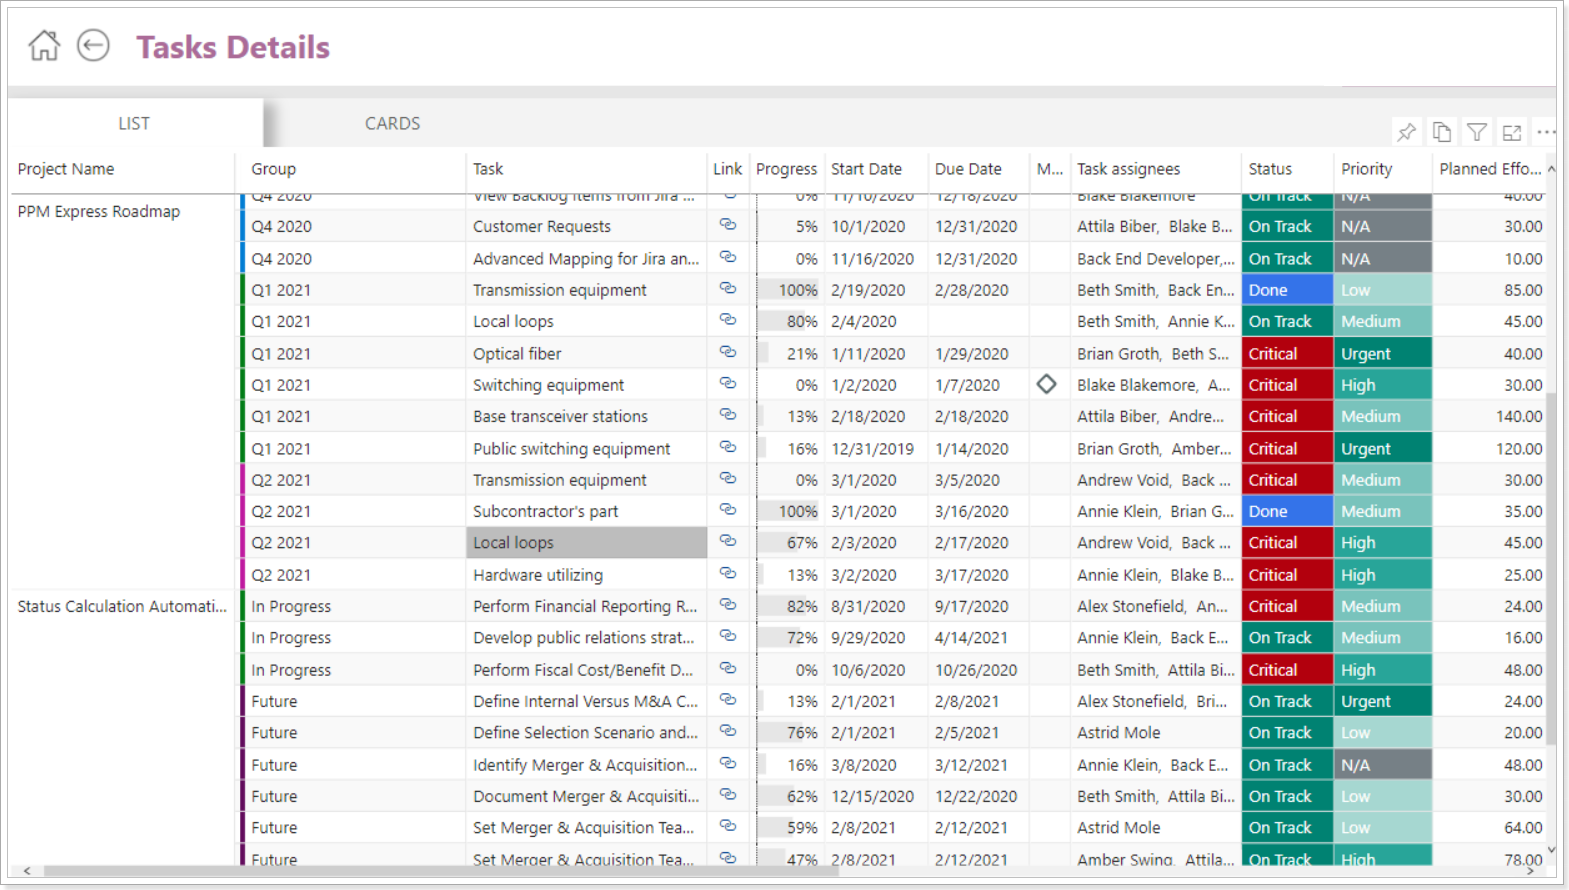
- as cards