
With the help of PPM Express OData, users are enabled to use the full functionality of custom Power BI reports.
It is possible to create custom Power BI reports on PPM Express data from scratch.
Before you start creating Custom Power BI reports on PPM Express Data, refer to the Creating Custom Power BI reports: recommended architecture article for the recommended approach that should be selected while creating Custom reports.
It is possible to add the fields to the custom report in bulk without specifying them by name. Because in Power BI Service the model is not rebuilt until you re-publish the report, you may face refreshing failures if you remove from PPM Express any fields of the same type you added to the report. The solution is to re-publish the report each time the field is deleted in PPM Express.
In this article, we will describe the example of the creation of the simplest custom Power BI report - a table of PPM Express Portfolios and Projects.
Before you start working on Power BI reports, open the PPM Express application and follow the steps in this article to copy the URL and Token that need to be provided in the Power BI application to extract data from PPM Express.
As you copy the URL and Token from the PPM Express 'OData management' page, you can start creating a custom Power BI report.
To create a report that displays Portfolios and Projects data on different pages perform the following steps:
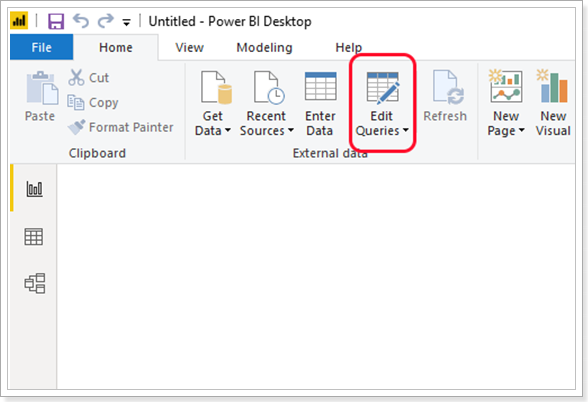
1. Run the Power BI Desktop application.
2. Select the Edit Queries option to open Power Query Editor.
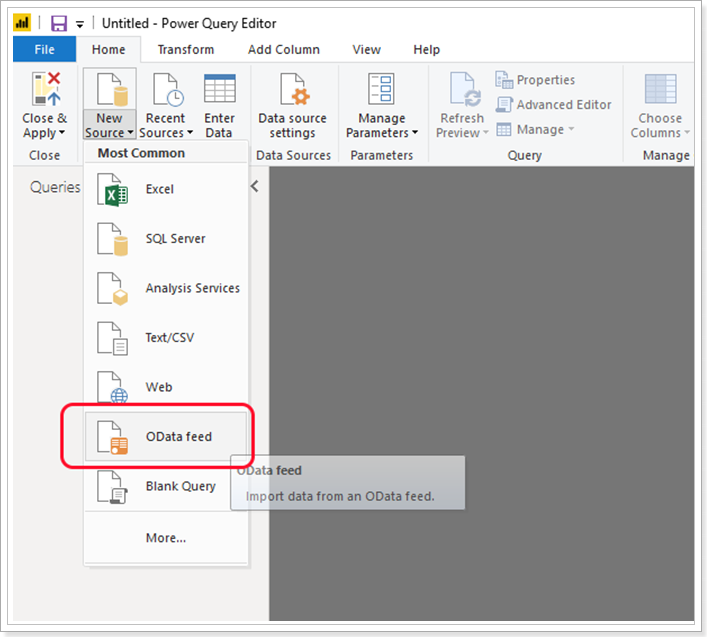
3. To create Portfolios and Projects queries select the OData feed on the ribbon.
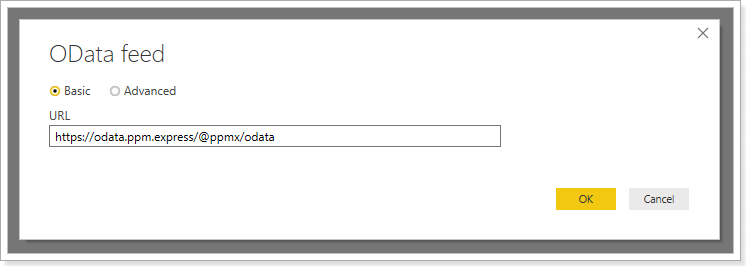
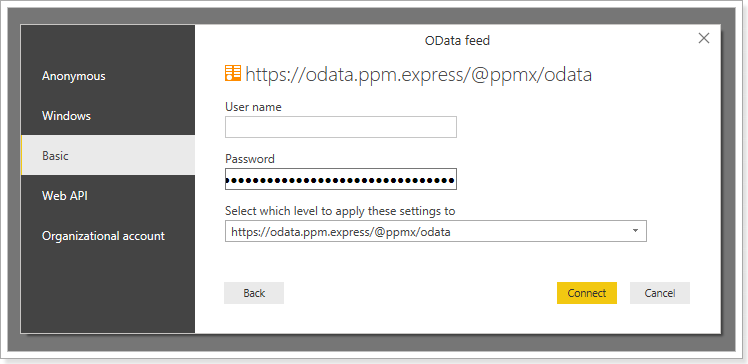
4. Specify the PPM Express OData URL (the URL copied previously from the PPM Express OData management page).
5. Specify your credentials (a token created and copied in PPM Express previously can be used as a password).
You can leave the 'User Name' field empty. It is not required when working with PPM Express OData.
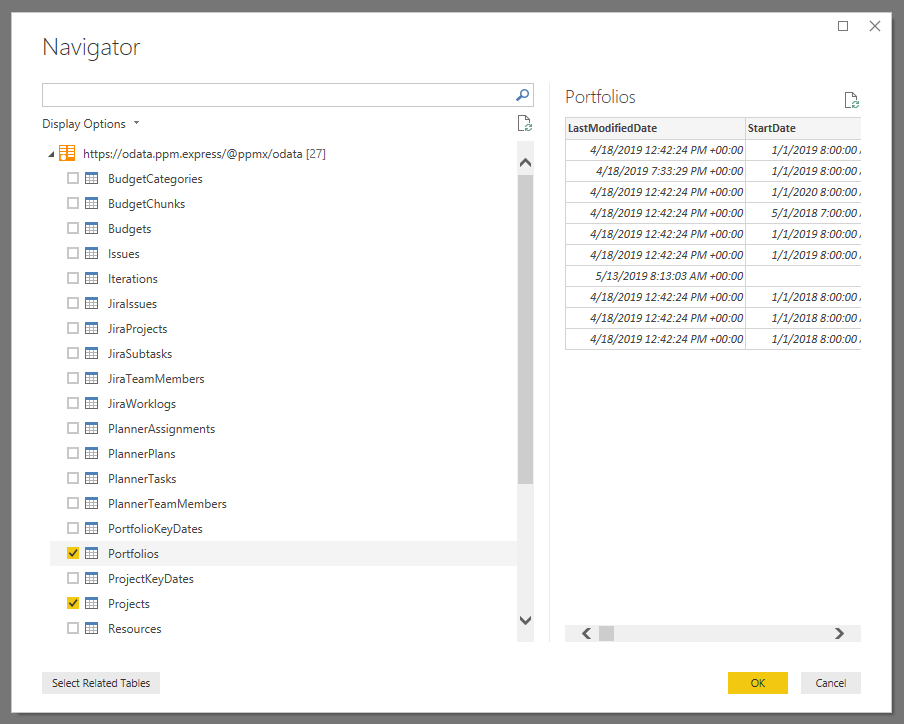
6. Select the feeds you are interested in. In this case, they are Portfolios and Projects.
7. Once queries are created, load data into the Model:
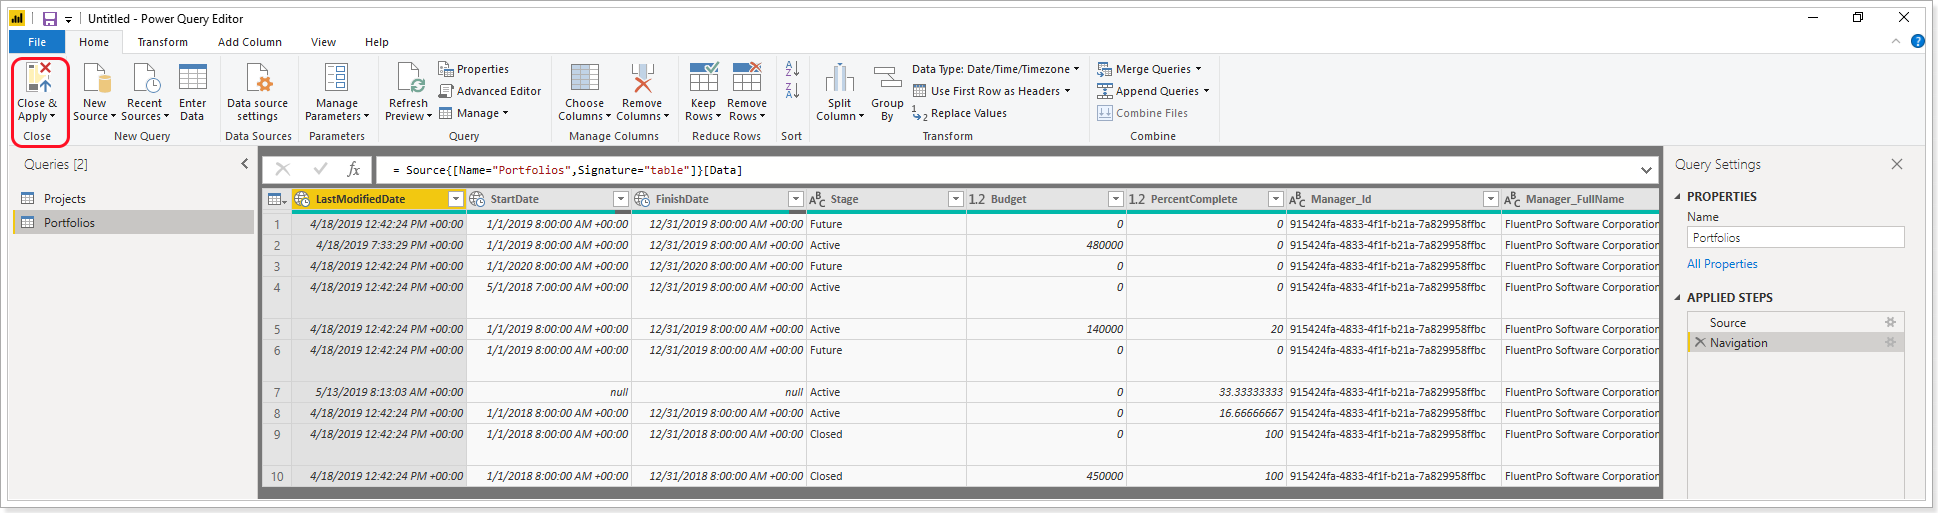
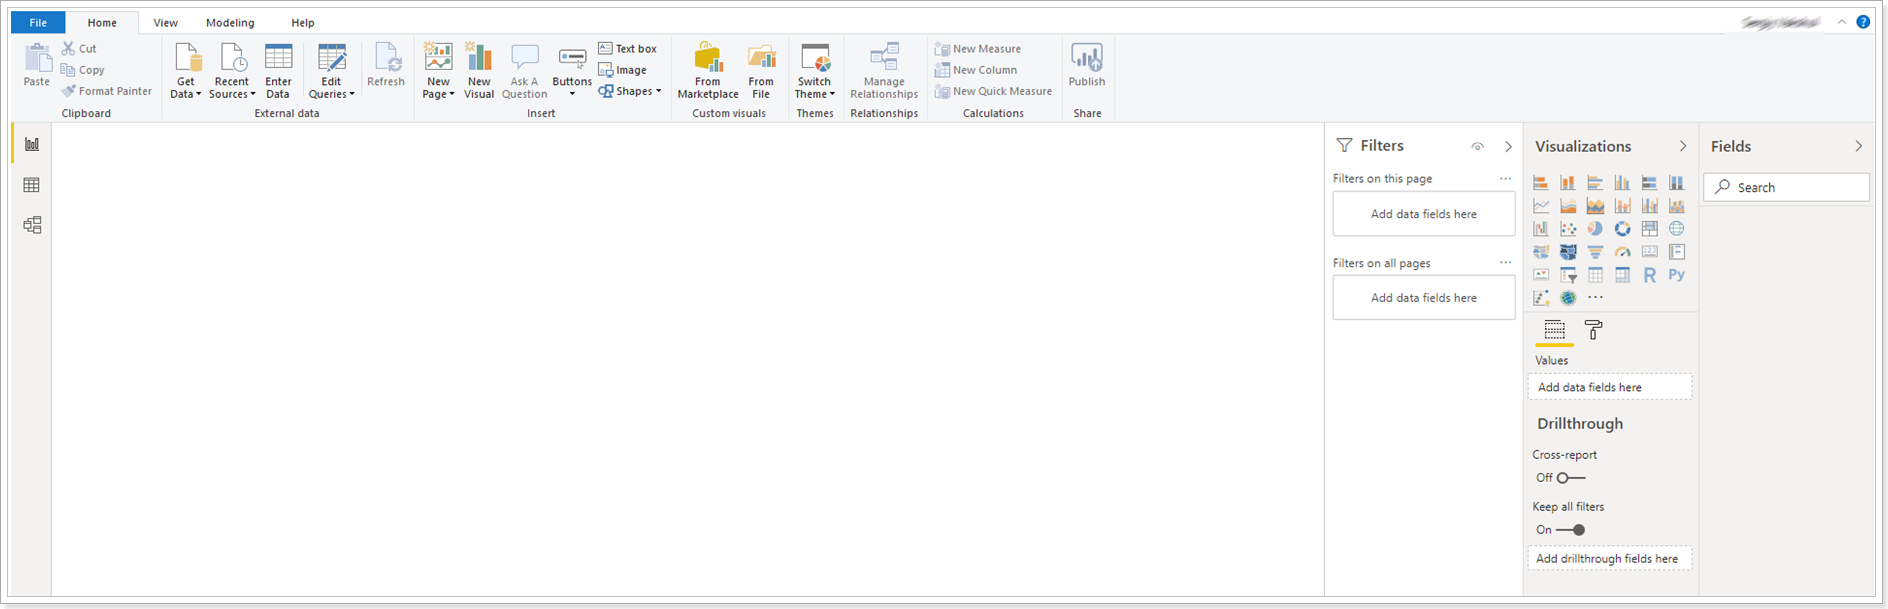
8. Now Portfolios and Projects tables are ready for creating report visuals.
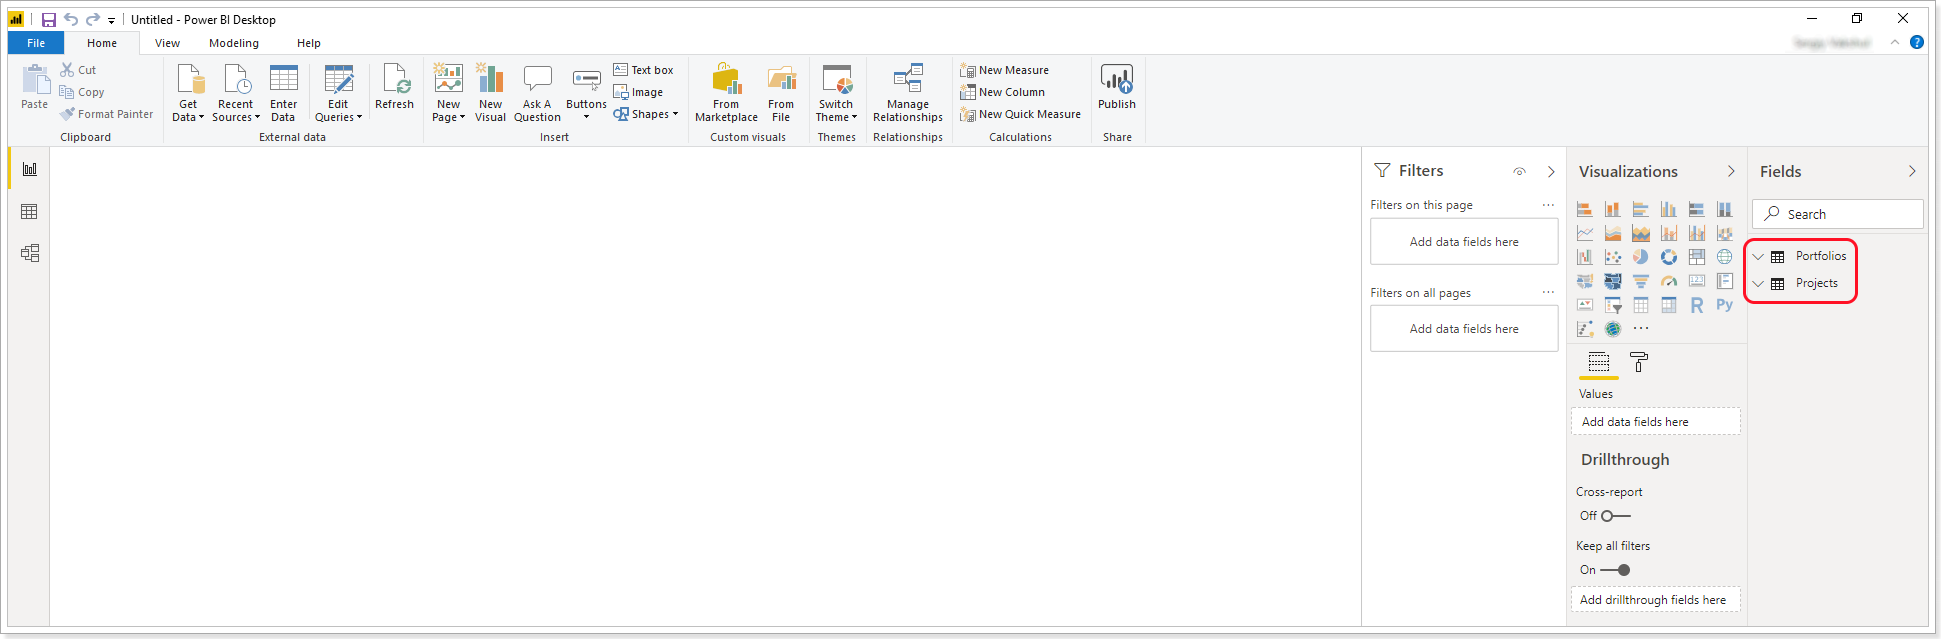
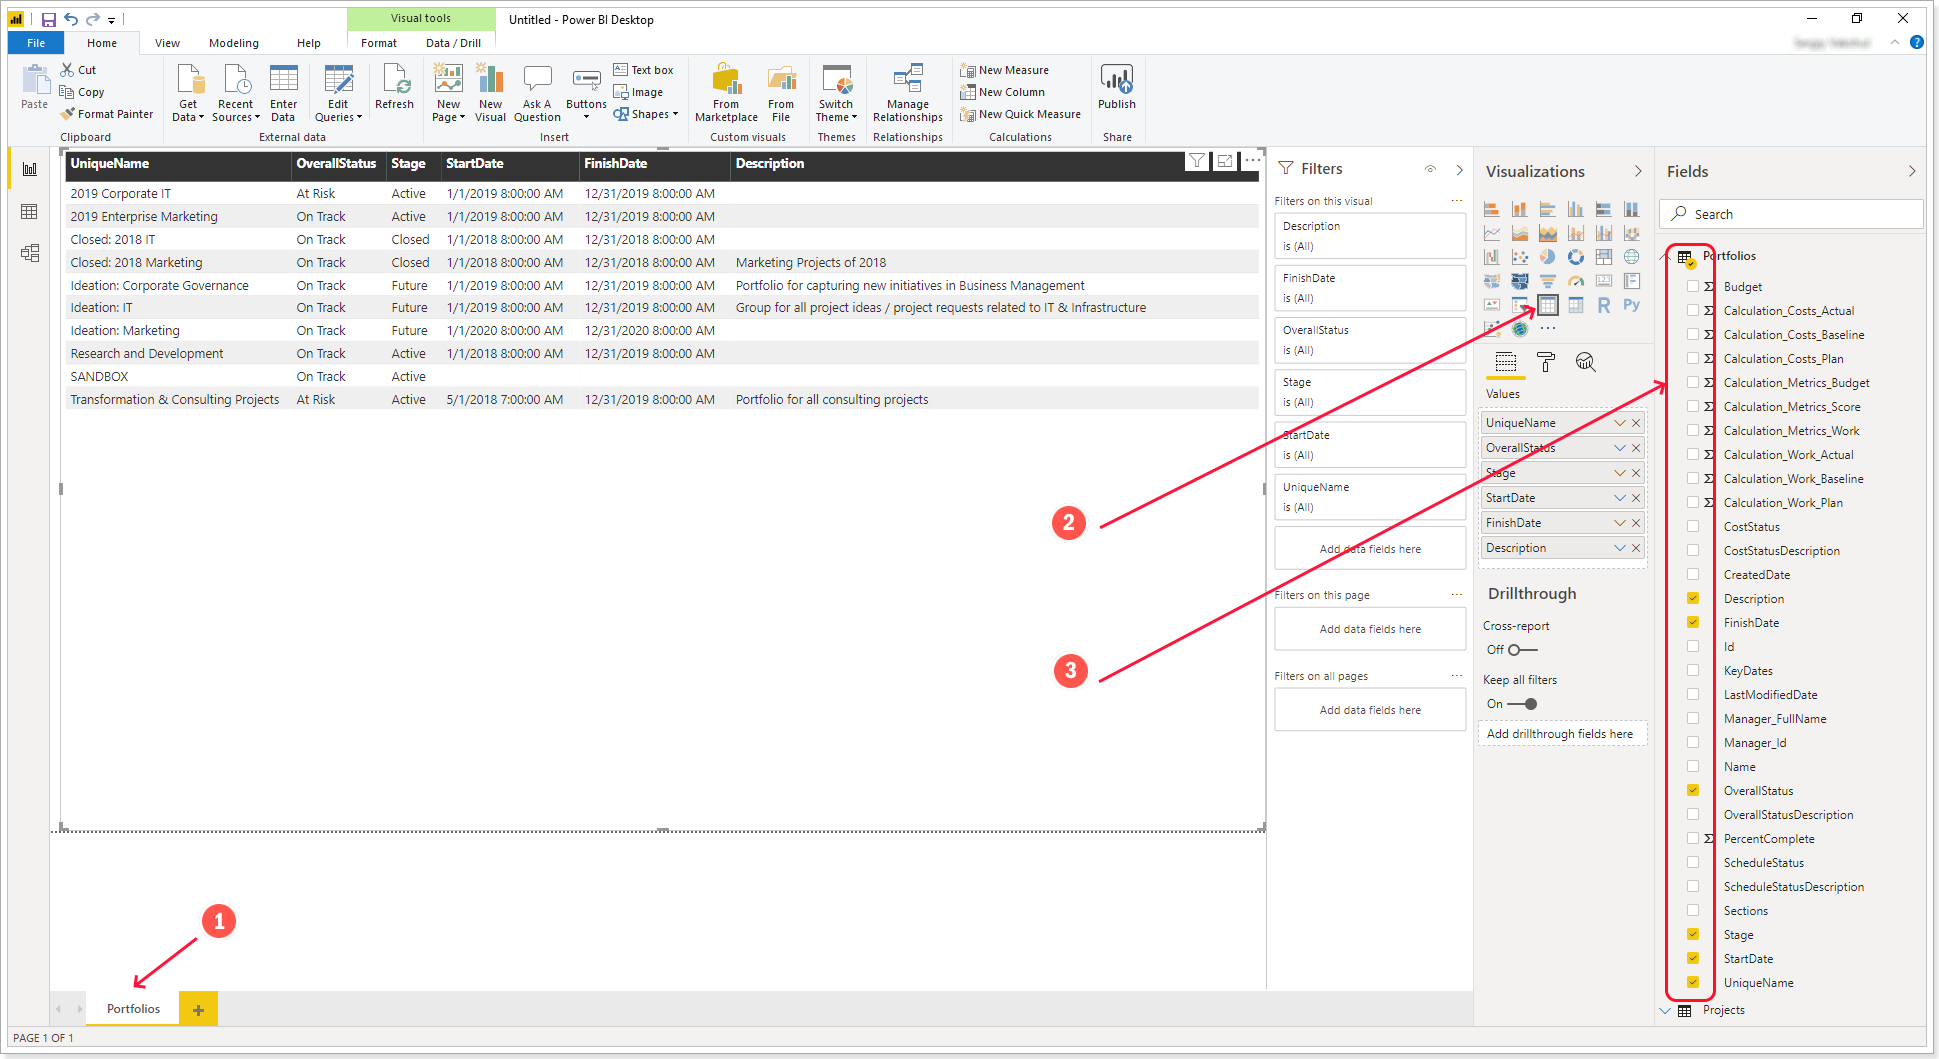
9. On the next step perform the following:
- Provide the current report page with an appropriate name;
- Create Table visualization by clicking on the “Table” icon in the Visualizations pane. An empty visual will appear on the page canvas.
- Specify columns to be displayed in your table by checking corresponding fields on the Fields pane.
10. Next, follow the same steps as in paragraph 9 to create a Projects page.
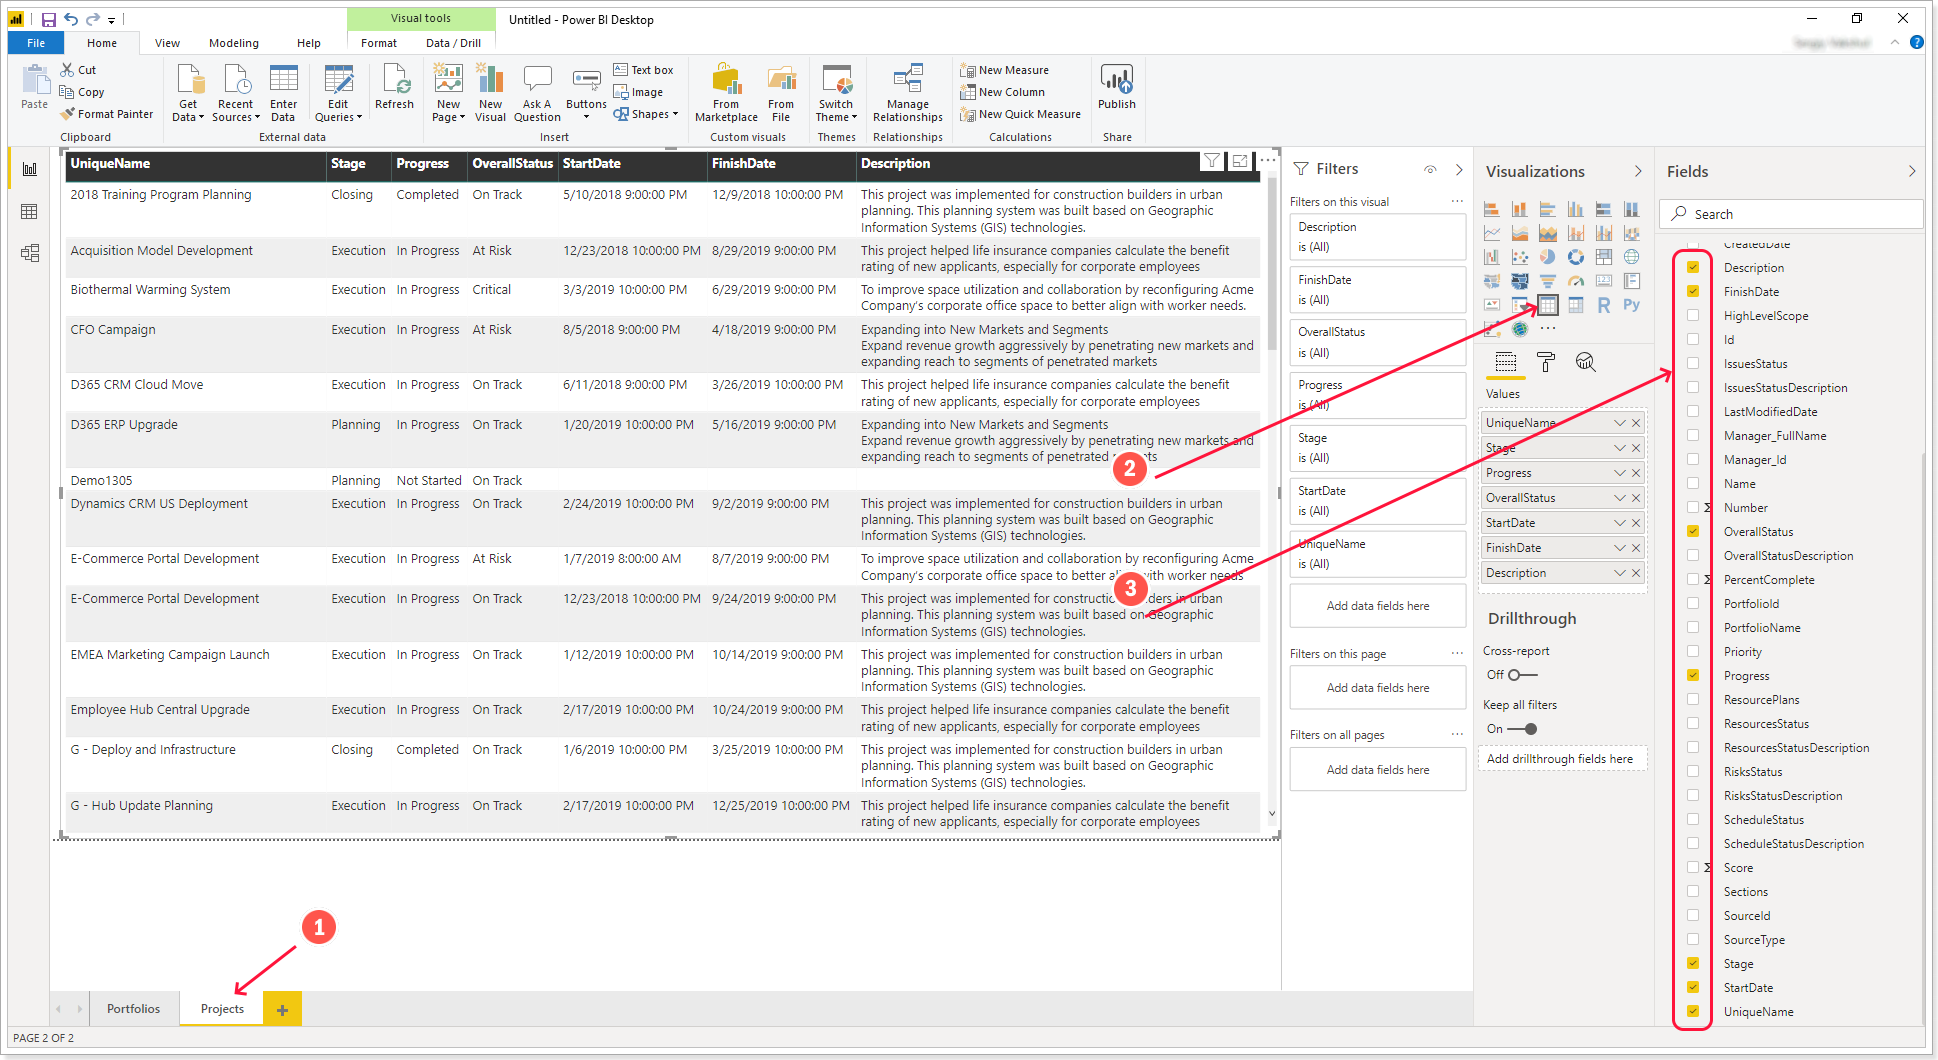
Now you can use a report that displays Portfolios and Projects data on different pages.
To get the most out of your data you can use the full functionality Power BI provides. Please find more information on Power BI following this link.