A Portfolio is used to group several Projects and/or Programs. It allows getting a quick representation of the planned and actual work, budgets and statuses for all the Projects included in it and the ones included in Programs. One particular Project/Program may be placed in several Portfolios.
The Portfolios page includes a list of all Portfolios created in PPM Express. For your convenience, it can be shown as a tileset, table, or timeline.
Inline editing is available on this page for your convenience. For more details, please refer to the 'How to use inline editing' article.
The Search option allows you to find the Portfolios you need quickly. For more details, please refer to the 'How to use the Search option' article.
Regardless of the view type used, the list of your Portfolios can be filtered using the Filter field in the upper right part of the screen. This control item also allows you to create filter presets.
The Activity Log option on the left tracks changes, helping users audit updates and understand when and how data was modified.

Portfolios: Card view
When the Card view is selected, the Portfolios page is shown as a tileset with a graphical representation of the actual stats for each Portfolio/Program in the Summary view.
Сosts/Work details selector in the left upper part of the screen allows changing this representation to the Work (showing stats for actual and planned work for each Portfolio) or Costs (showing cost stats).
The Activity Log option on the left tracks changes, helping users audit updates and understand when and how data was modified.

Also, the list of your Portfolios can be filtered using the Sort By option to sort the Portfolios by 'Newest on Top' and 'Oldest on Top', and alphabetically.
Using filters, you can quickly find the Portfolios you need on the page.
To edit any of the Portfolios available, click on it.
It is also possible to edit or delete Portfolios by clicking the ellipsis button and choosing Edit or Delete from the drop-down menu.
To export/import Portfolios to/from .csv file perform the steps described in the 'How to import/export portfolios' article.
Portfolios: Configurable table
The configurable table represents available Portfolios as a table. By default, it is switched to the General info view with only the basic stats for each Portfolio.
Using the View selector in the upper right of the screen, you can create and configure new Views to show additional columns for preferred stats of your Portfolios.
The Search option allows you to find the portfolios you need quickly. For more details, please refer to the 'How to use the Search option' article.
The Activity Log option on the left tracks changes, helping users audit updates and understand when and how data was modified.
To edit any of the Portfolios in the list, click on the ellipsis button and choose Edit from the drop-down menu.

To bulk edit or bulk delete Portfolios, select the ones you need in the configurable table view and click the Bulk edit or Bulk delete option as required.
You can apply a default layout to several Portfolios by selecting the required Portfolios and clicking the Layouts button. Using this button, you can apply the layout of the Portfolio dashboard that you created, and it will be applied to the selected Portfolios.

Portfolios: Timeline
Timeline is an easy and convenient representation of the start, finish, and deadline dates for each Project/Program in all available Portfolios.
In this view, you can edit any of the Portfolios or Projects by clicking on its name.
Similar to Configurable table data representation, by default, Timeline representation is switched to the General info view with only the basic info for each Portfolio.
The Search option allows you to find the portfolios you need quickly. For more details, please refer to the 'How to use the Search option' article.
The Activity Log option on the left tracks changes, helping users audit updates and understand when and how data was modified.
Using the View selector in the upper right of the screen, you can create and configure new Views to show additional columns for preferred stats of your Portfolios. Each custom view will still display timelines of Projects included in the Portfolio in addition to the columns selected for the custom view.

To bulk edit or bulk delete Portfolios, select the ones you need in the timeline view and click the Bulk edit or Bulk delete option as required.
It is also possible to apply a default layout to a number of Portfolios at one go by selecting the required Portfolios and clicking the Layout button. In this case, the selected layout of the Portfolio dashboard will be applied to the selected Portfolios.

The timeline color depends on the Project Progress and Overall Status:
- Blue - Project Progress is set to Completed
- Gray - Project Progress is set to Not Started
- Green - Project Progress is set to In Progress and Overall Status is set to On Track
- Orange - Project Progress is set to In Progress and Overall Status is set to At Risk
- Red - Project Progress is set to In Progress and Overall Status is set to Critical
- Dotted line - Project key dates or iterations are out of Project dates (Project start and end dates)
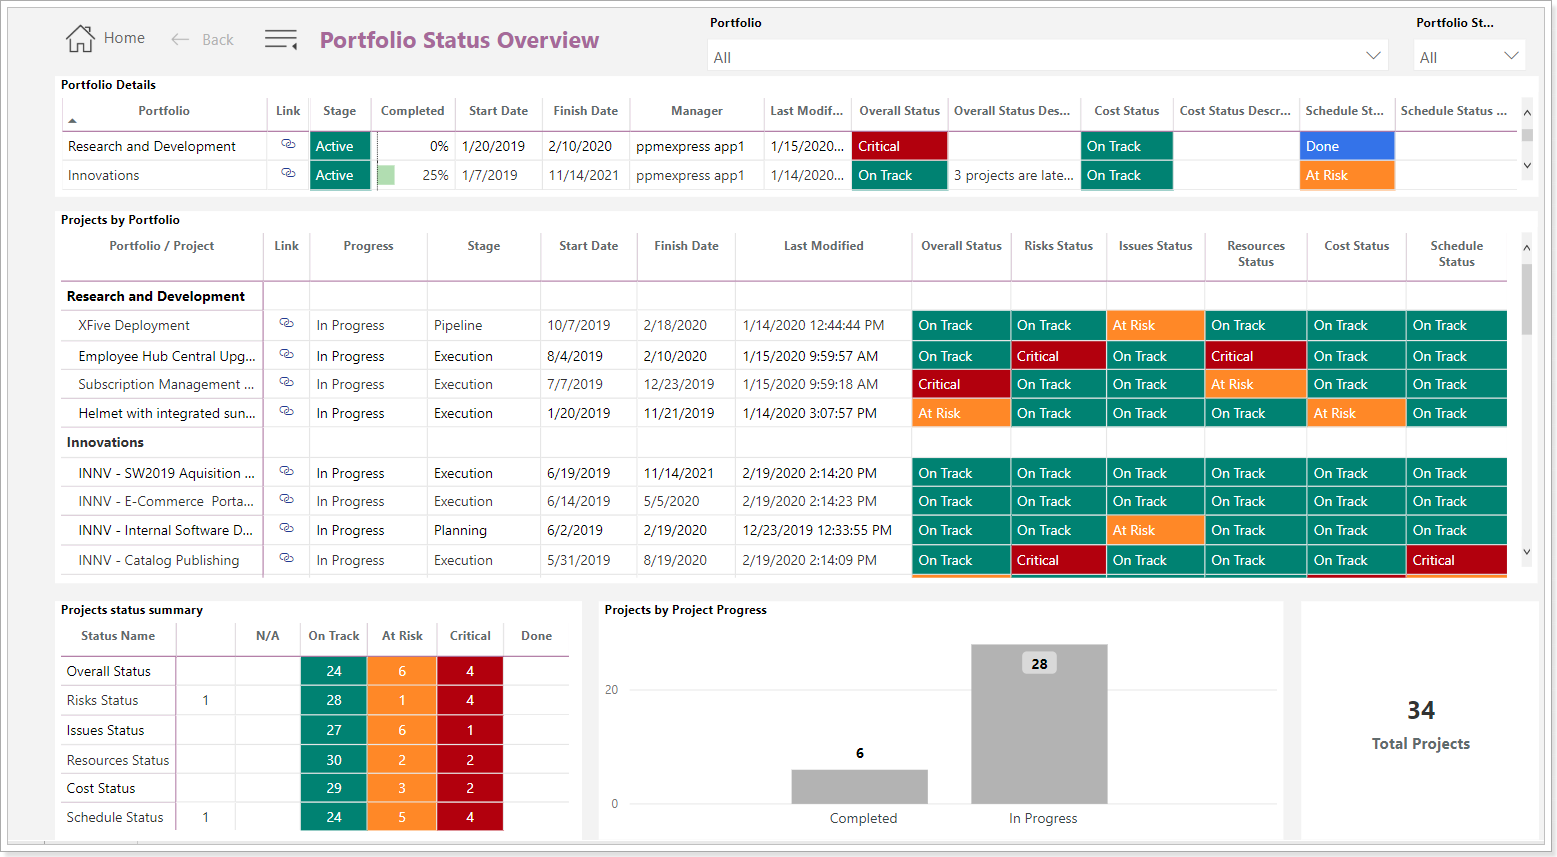
PPM Express Power BI Reports
PPM Express provides more than 50 accurate and comprehensive Power BI reports with a graphical representation of PPM Express data.
To enable PPM Express Power BI Reports, please follow the steps described in the 'Power BI reports' articles.
PPM Express provides an ability to review PPM Express Power BI Reports for the selected Portfolios on the Portfolio page.
A drop-down menu by the ellipsis button of each Portfolio opens PPM Express Power BI Reports for the selected Portfolio.

A drop-down menu is available in the Configurable Table view, and it opens PPM Express Power BI Reports for the selected Portfolio as well.
As you click on the report, it will open in a new window displaying the information for the selected report.