Projects page includes the list of all Projects imported into PPM Express, linked to the Projects from the external systems, or created manually within PPM Express.
Similar to the Portfolios page, the Projects page may be viewed as a tileset, configurable table, or timeline.

The Search option allows you to find the projects you need quickly. For more details, please refer to the 'How to use the Search option' article.
Also, the Activity Log option on the left tracks changes, helping users audit updates and understand when and how data was modified.
The list of your Projects can be filtered using the Filter field in the upper right part of the page. Using this control item, you can also create filter presets.
You can use the existing filters or create your own custom filters using the Filter option.
There are two prefilters and multiple default filters.
Default Pre-filters:
- Only Mine option allows displaying only the Projects where you are a Project Manager;
-
Favorite option allows displaying Projects that you visit the most. To simplify access to Projects you visit the most, these Projects can be added to Favorites. For this purpose, each Project has a star icon on the Project card and on the Project dashboard Summary section. This icon is also available in the configurable table view (only in the General Info view). Click the star icon to add the Project to Favorites. Click this icon to remove the Project from Favorites.
 The user can filter such projects by applying the project pre-filter "Favorite." Users can add a project to their favorites if they have at least View permission for the project.
 Also, users will receive Email summary notifications for projects added to Favorites.
Default filters include All, Active Projects, On Track Projects, At-risk Projects, etc.

The default filters can be edited as well. If you select any filter, let's take Active Projects as an example, you will see the filter attributes on the left.
If you click on the filter attribute, it will be opened for editing.

When you edit the default filters or create custom filters, you can use the custom fields you have added to the Details section of the Project dashboard.
Inline editing is available on this page for your convenience. For more details, please refer to the 'How to use inline editing' article.
To export/import projects to/from the .csv file, perform the steps described in the 'How to import/export projects' article.
Projects: Card view
Using the View selector in the upper right part of the screen, you can select which stats will be shown for each Project: Summary or Cost Details.

Using the Sort By option in the upper right part of the page, you can sort the Projects by 'Newest on Top' and 'Oldest on Top' alphabetically.

Also, the Activity Log option on the left tracks changes, helping users audit updates and understand when and how data was modified.
To edit a Project, click on the corresponding tile.
It is also possible to edit or delete Projects by clicking the ellipsis button and choosing Edit or Delete from the drop-down menu.
PPM Express allows tracking Project progress from the Linked Project icon(s) in the upper right part of each Project tile:
- for Project Online % Complete is displayed on the Linked Project icon;
- for Planner the first number shows the number of tasks with the status “Complete” and the second number shows the total number of tasks.
- for Jira the amount of “Story” issue types in the Project is displayed, where the first number is the number of entities with the status “Complete” and the second number is the total number of entities. If there are no “Story” issue types in the project, PPM Express will display the progress based on the amount of “Task” issue types.
- for Azure DevOps the amount of work items in the Project is displayed, where the first number is the number of work items with the status “Closed” and the second number is the total number of entities. By default, Project progress is calculated by User Stories for Projects created under the Agile process and by Tasks for Projects created under Basic, Scrum, and CMMI processes. Alternatively, you can enable state mapping of work items. Please find more details here.
- for Smartsheet the Completed tasks/ Total number of tasks is displayed. This number also depends on the field mapping, as the Completed field is calculated according to the mapping rules of the Progress PPM Express field.
- for Monday.com the Completed tasks/ Total number of tasks is displayed. This number also depends on the field mapping, as the Completed field is calculated according to the mapping rules of the Progress PPM Express field.
Also, PPM Express allows linking a Project to several Connections at once. If the Project is linked to several Connections, Project progress from several linked Connections will be available for review.

Click the Star icon to add the project to Favorites.
Projects: Configurable table
The configurable table represents available projects as a table. By default, it is switched to the General info view with basic stats only for each Project.
Using the View selector in the upper right part of the screen, you can create and configure new Views to show additional columns for preferred stats for each Project in the list.
The Favorites button allows adding Projects to Favorites, similar to the Card view data representation. The Favorites button is available only on the General info view.
The Search option allows you to find the projects you need quickly. For more details, please refer to the 'How to use the Search option' article.
Also, the Activity Log option on the left tracks changes, helping users audit updates and understand when and how data was modified.
The Tasks column displays the PPM Express Tasks icon and the icons of other connected systems linked to this Project. Clicking on the icon opens the Tasks page for the selected system.

To bulk edit or bulk delete Projects, select the ones you need in the configurable table view and click the Bulk Edit or Delete option as required.
The Run sync option allows running data synchronization for the selected Projects at one go.
The Archive option allows archiving selected projects. When the Projects are archived, they become available in read-only mode under the Settings (gear button) -> ‘Archived Projects’ option. The archived Project is removed from the Program and Portfolio. The rolled-up data such as Project Key Dates, Risks will be also removed from the Portfolio/Program where the project was included. Also, the archived Project data is not available in OData and thus in PPM Express Power BI Reports.
It is also possible to apply a layout to a number of Projects at one go by selecting the required Projects and clicking the Apply Layout button. In this case, the selected layout of the Project dashboard will be applied to the selected Projects.
If any of the selected projects are linked to the external system, you can use the Copy to PPM Express Tasks option to copy the tasks from the selected external system to the tasks page of the selected projects.
The Export to CSV option allows exporting the selected projects to a CSV file.
The Skip to stage option allows you to skip all selected projects to a specific stage.
The Apply Process button applies a process to all selected projects.
Additionally, if Project Story Reports are enabled on the tenant, users can share these reports via the Share report option in the project header. The feature is available only when the user has edit permissions for all selected projects, and none of them are private. Reports can be sent to tenant users or external email addresses, either as a single PDF or separate files. A maximum of 10 projects and 10 recipients can be selected.

Also, a few additional actions are available from the ellipsis button.

Projects: Timeline
The timeline shows the list of all available projects as a timeline chart, displaying the start, finish and deadline dates for each Project.
Click on the name of any Project to edit it.
Similar to Configurable table data representation, by default, Timeline representation is switched to the General info view with only the basic info for each Project.
The Search option allows you to quickly find the projects you need. For more details, please refer to the 'How to use the Search option' article.
Also, the Activity Log option on the left tracks changes, helping users audit updates and understand when and how data was modified.
Using the View selector in the upper right of the screen, you can create and configure new Views to show additional columns for preferred stats of your Projects. Each custom view will still display timelines of Project timelines in addition to the columns selected for the custom view.
Also, a few additional actions are available from the ellipsis button, for example, you can open the Project schedule and review PPM Express Project tasks.

To bulk edit or bulk delete Projects, select the ones you need in the timeline view and click the Bulk Edit or Delete option as required.
Run sync option allows running data synchronization for the selected Projects at once.
The Archive option allows archiving selected projects. When the Projects are archived, they become available in read-only mode under the Settings (gear button) -> ‘Archived Projects’ option. The archived Project is removed from the Program and Portfolio. The rolled-up data such as Project Key Dates, Risks will be also removed from the Portfolio/Program where the project was included. Also, the archived Project data is not available in OData and thus in PPM Express Power BI Reports.
It is also possible to apply a layout to a number of Projects at one go by selecting the required Projects and clicking the Apply Layout button. In this case, the selected layout of the Project dashboard will be applied to the selected Projects.
If any of the selected projects are linked to the external system, you can use the Copy to PPM Express Tasks option to copy the tasks from the selected external system to the tasks page of the selected projects.
The Export to CSV option allows exporting the selected projects to a CSV file.
The Skip to stage option allows you to skip all selected projects to a specific stage.
The Apply Process button applies a process to all selected projects.
Additionally, if Project Story Reports are enabled on the tenant, users can share these reports via the Share report option in the project header. The feature is available only when the user has edit permissions for all selected projects, and none of them are private. Reports can be sent to tenant users or external email addresses, either as a single PDF or separate files. A maximum of 10 projects and 10 recipients can be selected.

The timeline color depends on the project Progress and Overall Status:
- Blue - Project Progress is set to Completed
- Gray - Project Progress is set to Not Started
- Green - Project Progress is set to In Progress and Overall Status is set to On Track
- Orange - Project Progress is set to In Progress and Overall Status is set to At Risk
- Red - Project Progress is set to In Progress and Overall Status is set to Critical
- Dotted line - Project key dates or iterations are out of Project dates (Project start and end dates)
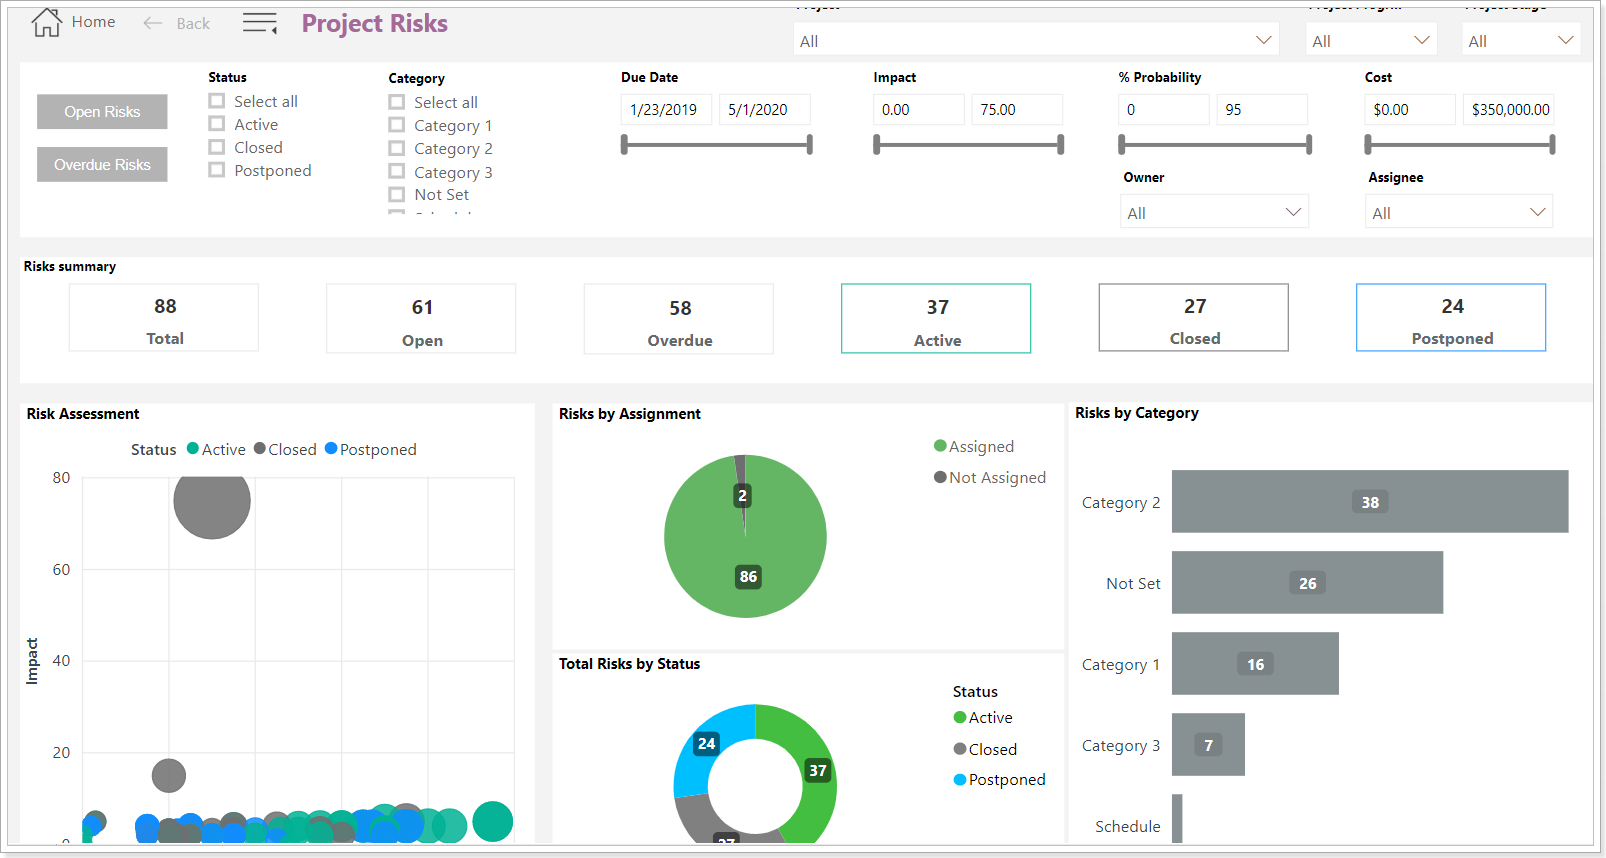
PPM Express Power BI Reports
PPM Express provides more than 50 accurate and comprehensive Power BI reports with a graphical representation of PPM Express data.
To enable PPM Express Power BI Reports, please follow the steps described in the Power BI Reports articles.
PPM Express provides an ability to review PPM Express Power BI Reports for the selected Projects on the Project page.
A drop-down menu by the ellipsis button of each Project opens PPM Express Power BI Reports for the selected Project.

As you click on the report, it will be opened in a new window displaying the information for the selected report.